Independent statistical decision tool | research date 2026-07-13
Crypto Signal Win Rate Confidence Calculator
A crypto signal service can display the same 90% win rate after 20 completed calls or 1,000. Those percentages look identical, but they do not carry the same uncertainty. Enter wins and losses below to calculate a Wilson interval, compare it with a threshold, and see a conservative sample-size planning count without turning the result into a profitability claim.
Direct answer: win rate is a point estimate, not a complete performance record. A confidence interval shows how much binomial sampling uncertainty remains around that estimate. It still cannot repair omitted losses, edited calls, correlated positions, inconsistent outcome rules, or missing execution costs.
- Interval method
- Wilson
- Scenario rows
- 48
- Planning rows
- 15
- Confidence levels
- 3
- Provider scores
- 0
Decision first
What this calculator can decide – and what it cannot
The calculator answers one narrow statistical question: if a set of completed outcomes can legitimately be treated as binary trials, what range of underlying win proportions is compatible with the observed wins and losses at the selected confidence level? It deliberately refuses to translate that range into a provider rating, expected return, safe position size, or purchase decision.
It can quantify interval uncertainty
Twenty outcomes provide less precision than one thousand outcomes even when the displayed percentage is the same. The interval makes that difference visible instead of hiding the denominator behind a large headline number.
It can compare with a chosen threshold
You can see whether the full interval is above, below, or overlaps a selected reference rate. The threshold is a comparison input, not a breakeven rate unless payoff size and trading costs are separately established.
It cannot validate the data
A clean calculation on a selected, edited, duplicated, or incomplete record produces a precise answer to the wrong denominator. Record integrity must be checked before statistical precision matters.
This calculator describes uncertainty around a binary win-loss proportion under stated assumptions. It does not verify the underlying trade record, prove independence, measure payoff size, include open or omitted calls, model fees or slippage, establish profitability, predict future performance, rank a provider, or recommend a trade or subscription.
Interactive tool
Calculate the interval around a reported win rate
Use completed binary outcomes only. If the source record has open calls, canceled calls, partial exits, moved stops, multiple targets, breakeven labels, edited entries, or duplicate alerts, define those rules before entering a count. The tool does not silently decide which outcomes belong in the denominator.
A 90% headline from 20 completed outcomes looks persuasive at first glance. The interval remains roughly 70% to 97%, which shows why the denominator belongs beside the percentage. This is a statistical illustration, not a claim about any provider.
Visual evidence
The same 60% result becomes more precise as the denominator grows
The green point in every row is 60%. The dark line is the 95% Wilson interval. At ten completed outcomes, a 6-4 record is compatible with a wide range of underlying proportions. At one thousand outcomes, a 600-400 record has a much narrower interval. More outcomes reduce binomial sampling uncertainty; they do not prove that the outcomes were selected or classified correctly.
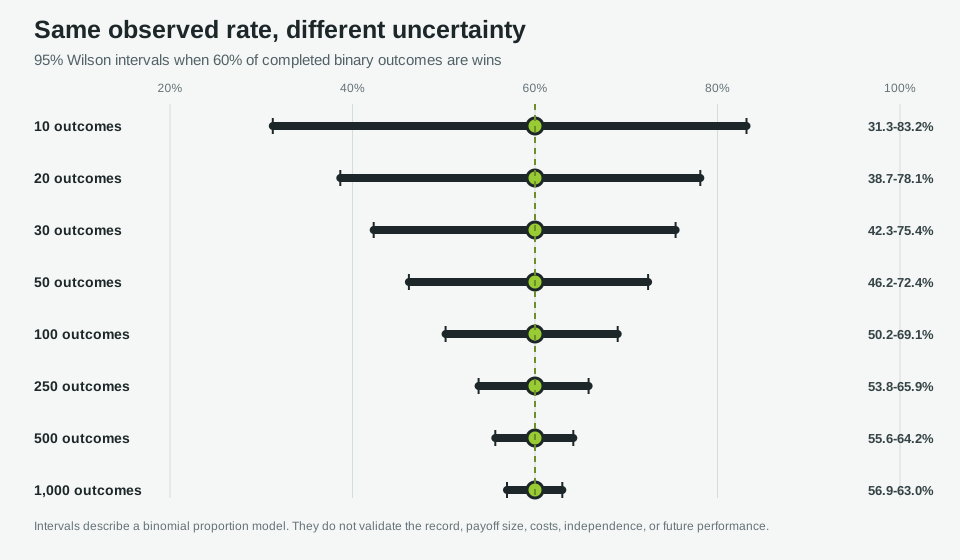
Read the chart in this order
- Confirm the completed-outcome count on the left.
- Find the green observed-rate point.
- Read the dark interval, not only the point.
- Return to the source record and test whether binary, complete, and consistent classification is defensible.
Do not use the chart as a provider leaderboard. A narrow interval around a low-quality denominator is not strong evidence.
Three 90% examples
A high percentage can be precise, imprecise, or simply unsupported
The examples below keep the displayed rate near 90% and change only the completed-outcome count. They isolate sample-size sensitivity so it cannot be confused with record verification. The exact intervals come from the public scenario dataset.
18 wins from 20 outcomes
18 wins and 2 losses produce a 95% Wilson interval of 69.9% to 97.2%. The headline is high, but the interval remains broad because two different losses would move the rate by ten percentage points at the same denominator.
90 wins from 100 outcomes
90 wins and 10 losses produce a 95% Wilson interval of 82.6% to 94.5%. The interval is narrower, yet record completeness, signal dependence, payoff size, costs, and market-regime coverage remain unresolved.
900 wins from 1,000 outcomes
900 wins and 100 losses produce a 95% Wilson interval of 88.0% to 91.7%. The binomial uncertainty is much smaller, but a precise estimate of a biased or selectively reported denominator is still not trustworthy.
More rows solve only one problem
A larger denominator can reduce uncertainty around the proportion represented by those rows. It does not show whether losing alerts were deleted, whether one call was split into several wins, whether targets moved after entry, or whether an account could execute at the displayed prices.
Precision is not economic value
A strategy can win often and lose more on each loss than it gains on each win. Another can win less often and still have positive expectancy before costs. Win rate needs payoff size, complete costs, exposure, drawdown, and consistent execution before it can support an economic conclusion.
Planning table
How many completed outcomes narrow a worst-case Wilson interval?
There is no universal minimum number of trades that makes a strategy valid. A sample-size requirement depends on the question, confidence level, desired precision, data dependence, and market coverage. The table answers a narrower planning question: at a 50% observed proportion, where binomial variance is widest, what is the smallest even denominator whose Wilson half-width is no larger than the selected target?
| Confidence | Target half-width | Planning count | 50% planning case | Actual half-width |
|---|---|---|---|---|
| 90% | +/- 1 points | 6,762 | 3,381 wins / 3,381 losses | 1.000 points |
| 90% | +/- 2 points | 1,690 | 845 wins / 845 losses | 1.999 points |
| 90% | +/- 3 points | 750 | 375 wins / 375 losses | 2.998 points |
| 90% | +/- 5 points | 268 | 134 wins / 134 losses | 4.999 points |
| 90% | +/- 10 points | 66 | 33 wins / 33 losses | 9.922 points |
| 95% | +/- 1 points | 9,600 | 4,800 wins / 4,800 losses | 1.000 points |
| 95% | +/- 2 points | 2,398 | 1,199 wins / 1,199 losses | 2.000 points |
| 95% | +/- 3 points | 1,064 | 532 wins / 532 losses | 2.999 points |
| 95% | +/- 5 points | 382 | 191 wins / 191 losses | 4.989 points |
| 95% | +/- 10 points | 94 | 47 wins / 47 losses | 9.907 points |
| 99% | +/- 1 points | 16,582 | 8,291 wins / 8,291 losses | 1.000 points |
| 99% | +/- 2 points | 4,142 | 2,071 wins / 2,071 losses | 2.000 points |
| 99% | +/- 3 points | 1,838 | 919 wins / 919 losses | 2.999 points |
| 99% | +/- 5 points | 658 | 329 wins / 329 losses | 4.996 points |
| 99% | +/- 10 points | 160 | 80 wins / 80 losses | 9.977 points |
The NIST sample-size guidance for testing proportions includes a null value, detectable change, significance level, and power. This page’s table instead solves an interval-width planning problem using the Wilson method at 50%. It is useful for seeing the cost of tighter precision, but it cannot choose a universal trade count or establish that market-regime coverage is adequate.
Complete scenario grid
Forty-eight reproducible win-rate and sample-size combinations
The scenario grid combines six target rates with eight sample sizes. Wins are rounded to a whole number and the displayed observed rate is recalculated from that integer count. Open one group to inspect the denominator, 95% interval, total interval width, and the effect of reclassifying one outcome at the same denominator.
About 50% observed wins across eight sample sizes
| Completed outcomes | Wins / losses | Observed rate | 95% Wilson interval | Interval width | One reclassification |
|---|---|---|---|---|---|
| 10 | 5 / 5 | 50.0% | 23.7% to 76.3% | 52.7 points | 10.0 points |
| 20 | 10 / 10 | 50.0% | 29.9% to 70.1% | 40.1 points | 5.0 points |
| 30 | 15 / 15 | 50.0% | 33.2% to 66.8% | 33.7 points | 3.3 points |
| 50 | 25 / 25 | 50.0% | 36.6% to 63.4% | 26.7 points | 2.0 points |
| 100 | 50 / 50 | 50.0% | 40.4% to 59.6% | 19.2 points | 1.0 points |
| 250 | 125 / 125 | 50.0% | 43.8% to 56.2% | 12.3 points | 0.4 points |
| 500 | 250 / 250 | 50.0% | 45.6% to 54.4% | 8.7 points | 0.2 points |
| 1,000 | 500 / 500 | 50.0% | 46.9% to 53.1% | 6.2 points | 0.1 points |
About 55% observed wins across eight sample sizes
| Completed outcomes | Wins / losses | Observed rate | 95% Wilson interval | Interval width | One reclassification |
|---|---|---|---|---|---|
| 10 | 6 / 4 | 60.0% | 31.3% to 83.2% | 51.9 points | 10.0 points |
| 20 | 11 / 9 | 55.0% | 34.2% to 74.2% | 40.0 points | 5.0 points |
| 30 | 17 / 13 | 56.7% | 39.2% to 72.6% | 33.4 points | 3.3 points |
| 50 | 28 / 22 | 56.0% | 42.3% to 68.8% | 26.5 points | 2.0 points |
| 100 | 55 / 45 | 55.0% | 45.2% to 64.4% | 19.1 points | 1.0 points |
| 250 | 138 / 112 | 55.2% | 49.0% to 61.2% | 12.2 points | 0.4 points |
| 500 | 275 / 225 | 55.0% | 50.6% to 59.3% | 8.7 points | 0.2 points |
| 1,000 | 550 / 450 | 55.0% | 51.9% to 58.1% | 6.2 points | 0.1 points |
About 60% observed wins across eight sample sizes
| Completed outcomes | Wins / losses | Observed rate | 95% Wilson interval | Interval width | One reclassification |
|---|---|---|---|---|---|
| 10 | 6 / 4 | 60.0% | 31.3% to 83.2% | 51.9 points | 10.0 points |
| 20 | 12 / 8 | 60.0% | 38.7% to 78.1% | 39.5 points | 5.0 points |
| 30 | 18 / 12 | 60.0% | 42.3% to 75.4% | 33.1 points | 3.3 points |
| 50 | 30 / 20 | 60.0% | 46.2% to 72.4% | 26.2 points | 2.0 points |
| 100 | 60 / 40 | 60.0% | 50.2% to 69.1% | 18.9 points | 1.0 points |
| 250 | 150 / 100 | 60.0% | 53.8% to 65.9% | 12.1 points | 0.4 points |
| 500 | 300 / 200 | 60.0% | 55.6% to 64.2% | 8.6 points | 0.2 points |
| 1,000 | 600 / 400 | 60.0% | 56.9% to 63.0% | 6.1 points | 0.1 points |
About 70% observed wins across eight sample sizes
| Completed outcomes | Wins / losses | Observed rate | 95% Wilson interval | Interval width | One reclassification |
|---|---|---|---|---|---|
| 10 | 7 / 3 | 70.0% | 39.7% to 89.2% | 49.5 points | 10.0 points |
| 20 | 14 / 6 | 70.0% | 48.1% to 85.5% | 37.4 points | 5.0 points |
| 30 | 21 / 9 | 70.0% | 52.1% to 83.3% | 31.2 points | 3.3 points |
| 50 | 35 / 15 | 70.0% | 56.3% to 80.9% | 24.6 points | 2.0 points |
| 100 | 70 / 30 | 70.0% | 60.4% to 78.1% | 17.7 points | 1.0 points |
| 250 | 175 / 75 | 70.0% | 64.1% to 75.3% | 11.3 points | 0.4 points |
| 500 | 350 / 150 | 70.0% | 65.8% to 73.9% | 8.0 points | 0.2 points |
| 1,000 | 700 / 300 | 70.0% | 67.1% to 72.8% | 5.7 points | 0.1 points |
About 80% observed wins across eight sample sizes
| Completed outcomes | Wins / losses | Observed rate | 95% Wilson interval | Interval width | One reclassification |
|---|---|---|---|---|---|
| 10 | 8 / 2 | 80.0% | 49.0% to 94.3% | 45.3 points | 10.0 points |
| 20 | 16 / 4 | 80.0% | 58.4% to 91.9% | 33.5 points | 5.0 points |
| 30 | 24 / 6 | 80.0% | 62.7% to 90.5% | 27.8 points | 3.3 points |
| 50 | 40 / 10 | 80.0% | 67.0% to 88.8% | 21.8 points | 2.0 points |
| 100 | 80 / 20 | 80.0% | 71.1% to 86.7% | 15.5 points | 1.0 points |
| 250 | 200 / 50 | 80.0% | 74.6% to 84.5% | 9.9 points | 0.4 points |
| 500 | 400 / 100 | 80.0% | 76.3% to 83.3% | 7.0 points | 0.2 points |
| 1,000 | 800 / 200 | 80.0% | 77.4% to 82.4% | 5.0 points | 0.1 points |
About 90% observed wins across eight sample sizes
| Completed outcomes | Wins / losses | Observed rate | 95% Wilson interval | Interval width | One reclassification |
|---|---|---|---|---|---|
| 10 | 9 / 1 | 90.0% | 59.6% to 98.2% | 38.6 points | 10.0 points |
| 20 | 18 / 2 | 90.0% | 69.9% to 97.2% | 27.3 points | 5.0 points |
| 30 | 27 / 3 | 90.0% | 74.4% to 96.5% | 22.2 points | 3.3 points |
| 50 | 45 / 5 | 90.0% | 78.6% to 95.7% | 17.0 points | 2.0 points |
| 100 | 90 / 10 | 90.0% | 82.6% to 94.5% | 11.9 points | 1.0 points |
| 250 | 225 / 25 | 90.0% | 85.7% to 93.1% | 7.5 points | 0.4 points |
| 500 | 450 / 50 | 90.0% | 87.1% to 92.3% | 5.3 points | 0.2 points |
| 1,000 | 900 / 100 | 90.0% | 88.0% to 91.7% | 3.7 points | 0.1 points |
Rounding matters in small samples. A target of 55% cannot be represented exactly in every denominator. The dataset preserves the target rate and the actual integer-derived observed rate so a convenient label never replaces the count.
Evidence gate
Six record checks must pass before the interval deserves attention
Statistical calculation comes after record definition. These checks are deliberately operational: each asks for a rule or record that can be preserved and reviewed. A provider screenshot, monthly percentage, or selected success feed does not answer them by itself.
Fix eligibility before outcomes
Define which alerts enter the denominator before reading whether they won or lost.
Preserve the complete chronology
Keep entries, invalidations, edits, cancellations, open calls, exits, and timestamps in one loss-inclusive record.
Use one outcome rule
Apply the same entry, target, stop, timeout, partial-fill, and breakeven treatment to every eligible signal.
Separate signal from execution
A clean signal-level hit rate does not include the buyer’s fill, fees, spread, slippage, funding, size, or missed alerts.
Inspect dependence and regimes
Repeated calls on one asset, correlated positions, overlapping trades, and one market regime weaken the independent-trial model.
Keep payoff and drawdown separate
Win rate alone omits average gain, average loss, loss streaks, drawdown, exposure, leverage, and account survival.
Open and canceled calls need their own rule
Excluding every open or canceled alert can raise or lower a reported rate depending on how the provider manages losing positions. Decide whether an alert becomes eligible at publication, entry, fill, or another fixed event. Then preserve every eligible state transition instead of dropping unresolved rows from the denominator.
Multiple targets need one accounting convention
A signal that touches target one and later stops out can be described as a win, a loss, a partial result, or several results depending on the rule. The interval cannot choose that convention. The same predeclared rule must be applied to every signal before wins and losses are counted.
Edited timestamps can change eligibility
An entry range or stop changed after price moved is not the same instruction a follower received at the original timestamp. Preserve edit history and original content. If chronology cannot be reconstructed, the row should remain unresolved rather than forced into the favorable class.
Correlated calls are not independent evidence
Five long altcoin alerts opened during one market move may fail or succeed together. Treating them as five independent trials understates shared-regime risk. Clustered assets, overlapping positions, repeated entries, and copied strategies need a dependence analysis beyond this calculator.
Interpretation boundary
Why a confidence interval still does not prove profitability
A binary hit rate discards the size and path of each outcome. That compression can be useful when the outcome rule is fixed, but it cannot answer whether an account gained money, survived the drawdown, or could reproduce the signal. Keep the following measures outside the win-rate interval and inspect them separately.
Average gain and average loss
Ten small winning exits can be erased by one leveraged loss. A complete result sheet needs realized payoff size in a consistent unit, such as account return or risk multiples, with partial exits and position size preserved.
Fees, spread, slippage, and funding
A signal can touch a chart level without producing the same fill for a follower. Market orders, thin books, delayed alerts, taker fees, perpetual funding, and withdrawal or conversion costs can change account results without changing the provider’s binary label.
Loss streak and drawdown path
The same final win-loss count can arrive in different orders. Consecutive losses affect margin, behavior, and account survival. The CFTC warns that hypothetical results may not capture a trader’s ability to absorb losses or margin calls.
Market regime and forward validity
A narrow historical interval may describe one bull, bear, volatility, liquidity, or exchange regime. It does not establish that the process remains stable after publication, model changes, asset changes, or crowding.
Use the narrowest defensible conclusion: the entered record has an observed binary proportion and a model-based interval under stated assumptions. Any claim about account return, future performance, provider quality, safety, or suitability needs different evidence.
Method
Wilson interval, planning method, and reproducibility
The Wilson score interval is calculated from integer wins, integer completed outcomes, and the z value associated with the selected two-sided confidence level. It avoids the simple symmetric normal interval’s most obvious boundary problems, especially for small samples or proportions near zero or one. The calculator clamps the displayed interval to zero through one.
center = (p_hat + z^2 / (2n)) / (1 + z^2 / n)
half_width = z * sqrt(p_hat(1 - p_hat) / n + z^2 / (4n^2)) / (1 + z^2 / n)
interval = center +/- half_width
Confidence does not describe this one interval’s probability
A 95% procedure means that across repeated samples generated under the model, about 95% of intervals constructed by the procedure would contain the underlying proportion. It is not a 95% guarantee that this provider will keep the same rate or that the true value is inside this one interval.
The planning count is deliberately conservative
For each confidence and margin target, the generator searches even denominators at a 50% observed proportion until the Wilson half-width meets the target. The 50% case is used because binomial variance is widest there. The result is a precision planning count, not a test of edge.
Every published number is generated
The HTML tables, interactive defaults, summary JSON, two CSV files, and SVG figure use the same z values and Wilson implementation. The checker recalculates every row independently and rejects drift between the static page, WordPress mirror, plugin payloads, and public distributions.
The first-party audit is context, not training data
The frozen 16-provider performance-claims audit found zero complete independently reproduced provider-wide records in its defined cohort. This calculator does not import any provider percentage from that audit. It uses the finding only to explain why denominator quality must remain visible.
Official source register
What the sources support – and where they stop
The statistical method comes from NIST proportion guidance. The trading-result caution comes from the CFTC. Neither source evaluates CryptoSignalsReview, a provider in the first-party cohort, or any user-entered record. Source scope is shown beside each link so authority is not stretched beyond what the page establishes.
- 7.2.4.1. Confidence intervalsNIST/SEMATECH | accessed 2026-07-13
Defines confidence intervals for proportions and documents the Wilson method used by the calculator.
Boundary: The NIST example concerns proportions generally; it does not validate crypto signals or the quality of any trade record.
- 7.2.4.2. Sample sizes requiredNIST/SEMATECH | accessed 2026-07-13
Provides official context that proportion sample-size planning depends on the question, deviation, significance, and power assumptions.
Boundary: The page’s calculator uses a separate, explicitly labeled Wilson interval-width planning count, not the NIST hypothesis-test power formula.
- Commodity Trading Systems Sold on the InternetU.S. Commodity Futures Trading Commission | accessed 2026-07-13
Provides official context on hypothetical trading results, omitted costs, actual market conditions, and consecutive losses.
Boundary: The advisory is general investor-protection context and does not evaluate any provider in the first-party audit.
Derived interval and planning rows may be reused with the canonical URL, confidence level, counts, method, research date, and decision boundary intact. Do not relabel a confidence interval as verified accuracy, profitability, safety, future performance, or provider quality. Submit a correction through the evidence route. Paid production, sponsorship, or profile work cannot alter the formula, dataset, risk note, or conclusion.
Continue the evidence chain
Use the interval beside the record, cost, and execution checks
Preserve the complete loss-inclusive record, define the outcome rule, and enter only completed binary outcomes. Then use the interval as one uncertainty measure. If the chronology or denominator cannot be reproduced, stop at “record unresolved” instead of manufacturing a precise conclusion.