Independent sequence-risk tool | research date 2026-07-13
Crypto Signal Losing Streak Probability Calculator
A strong-looking win rate does not make consecutive losses unusual. Enter an assumed win rate, a number of completed outcomes, and a target run length to calculate the exact model probability of at least one losing streak. The page also exposes a common shortcut that overcounts overlapping windows, so the method can be checked rather than trusted as a black box.
Direct answer: under an independent 60% win model, 100 completed outcomes have a 45.91% chance of containing at least one run of five losses. The familiar independent-window shortcut gives 62.77% because it wrongly treats overlapping candidate windows as independent.
- Exact method
- State recurrence
- Scenario rows
- 144
- Default exact result
- 45.9%
- Default shortcut
- 62.8%
- Provider scores
- 0
Decision boundary
What this calculator decides, and what it leaves unresolved
This is an order-sensitive probability tool. It answers whether a sequence with one assumed win probability is likely to contain at least one specified run of losses. That is different from counting total losses, estimating the true win rate, measuring average loss size, or asking whether a subscription can break even. The narrow scope is deliberate: a useful answer keeps the model and the evidence question separate.
It calculates a sequence event
The same number of wins and losses can appear in many orders. A run of five losses depends on that order. The dynamic program preserves the relevant trailing-loss state after every completed outcome and sums only sequences that have not yet reached the target run.
It compares exact and shortcut math
A specified five-outcome block has loss probability q to the fifth power. A longer record contains many possible starting positions, but adjacent positions share outcomes. The comparison shows why raising one-block survival to the number of overlapping windows is not an exact solution.
It does not validate the input rate
An advertised rate may use selected calls, edited entries, missing stops, multiple targets, or incomplete chronology. The calculator treats the entered rate as an explicit assumption. It does not transform a marketing claim into measured evidence.
This calculator answers a narrow probability question under an independent, constant-probability Bernoulli model. It does not verify a provider’s record, estimate a true win rate, prove independence, model changing market regimes, include open or omitted calls, measure payoff size, fees, slippage, funding, leverage, drawdown or account survival, predict future results, rank a provider, or recommend a trade, risk size, or subscription.
Interactive calculator
Calculate the exact chance of at least one losing streak
Use one assumed win probability for all completed outcomes. The default is not a provider claim: it is a transparent 60% win, 40% loss illustration across 100 completed binary outcomes. Change any input and the exact absorbing-state recurrence is recalculated in your browser. No account, API call, tracking request, or provider score is involved.
The primary number is exact for the stated mathematical model. It is not the exact future probability for a provider, trading system, account, or market regime. That real-world claim would require a defensible probability estimate, a complete chronology, and evidence that independence and stability are reasonable.
Visual evidence
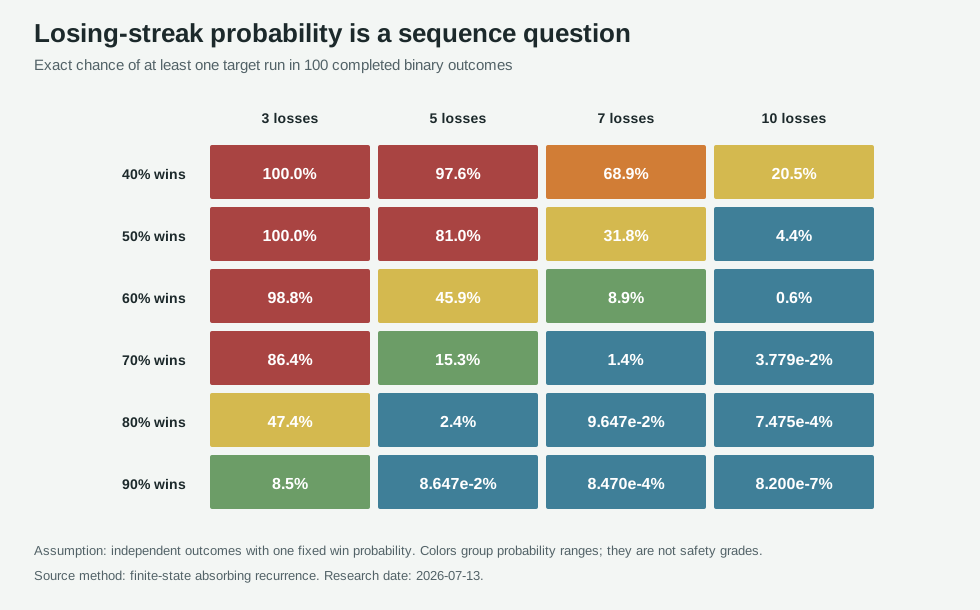
One hundred outcomes can contain a loss run even at a high assumed win rate
The grid fixes the record length at 100 outcomes, then changes the assumed win rate and the target run length. Shorter target runs become common quickly because there are many possible places for them to begin. Longer runs remain less likely, especially when the assumed loss probability is small. The colors group probabilities for scanning; they are not quality, safety, or provider grades.
Mechanism
The exact recurrence tracks only the trailing losses that still matter
The algorithm computes the complement event: no target run has appeared yet. It does not enumerate every possible sequence, which would double the search space with each additional outcome. Instead, it keeps r states. State zero means the latest outcome is a win or the sequence is empty. State j means the sequence is still target-run free and currently ends with j consecutive losses.
On a win, every safe state resets
Add all current no-run state probabilities, multiply by p, and place the result in state zero. A win breaks any trailing loss run, so every still-safe history reaches the same reset state.
On a loss, the trailing state advances
For states zero through r minus two, multiply by q and move the probability to the next state. A loss from state r minus one completes the target streak. That transition leaves the no-run state space and is added directly to an absorbing target-run total with compensated summation.
After n outcomes, compare both masses
The absorbing total is the exact probability of at least one target run. The remaining state sum is the exact no-run probability. They should add to one within floating-point tolerance. Direct absorption avoids losing a tiny run probability by subtracting a near-one no-run value from one.
The state meaning is inspectable
No simulation seed, random sample, fitted coefficient, provider label, or hidden prior is involved. Given p, n, and r, repeated implementations of the same recurrence should agree within ordinary floating-point tolerance.
- Assumption 1Every included outcome is classified using one predeclared binary win-loss rule.
- Assumption 2Outcomes are independent under the model.
- Assumption 3The win probability p is fixed across all n outcomes.
- Assumption 4The sequence contains the complete eligible chronology rather than a selected subset.
- Assumption 5The result is a model calculation, not an estimate of the provider’s unknown true process.
Shortcut audit
Why overlapping candidate windows cannot be treated as independent
A record of n outcomes contains n minus r plus one possible starting positions for a run of length r. It is tempting to calculate the chance that each position is not all losses and then multiply those survival probabilities. That multiplication assumes the candidate windows are independent. Adjacent windows share r minus one outcomes, so the assumption fails precisely where the runs overlap. The shortcut does match the exact result when r is one, when r equals n, or at the zero- and one-hundred-percent win-rate boundaries; those cases contain no dependent multi-outcome overlap to approximate.
A fixed block is simple
For one prespecified block of r independent outcomes, every outcome must be a loss. The probability is q raised to r. This is exact only for that one block, such as outcomes 1 through 5.
Adjacent blocks share evidence
Outcomes 1 through 5 and outcomes 2 through 6 share outcomes 2 through 5. Learning that the first block is all losses changes what is known about the second. Multiplying them as independent events counts the shared structure incorrectly.
The size of the error varies
At the default 60%, 100, and five-loss inputs, the shortcut is 62.77% while the exact result is 45.91%. The 16.86-point gap is a method error, not a confidence interval.
| Assumed wins | Completed outcomes | Target streak | Exact probability | Window shortcut | Overstatement |
|---|---|---|---|---|---|
| 50% | 100 | 5 losses | 81.0110% | 95.2540% | 14.2431 points |
| 60% | 100 | 5 losses | 45.9074% | 62.7720% | 16.8646 points |
| 70% | 200 | 6 losses | 9.5212% | 13.2558% | 3.7347 points |
| 90% | 20 | 3 losses | 1.6214% | 1.7848% | 0.1634 points |
| 40% | 50 | 5 losses | 83.5036% | 97.5855% | 14.0819 points |
| 99% | 10000 | 10 losses | 9.891e-15% | 9.991e-15% | 9.990e-17 points |
| 99.9% | 10000 | 5 losses | 9.986e-10% | 9.996e-10% | 9.995e-13 points |
| 0% | 10000 | 10 losses | 100.0000% | 100.0000% | 0.0000 points |
| 100% | 10000 | 10 losses | 0.0000% | 0.0000% | 0.0000 points |
It is useful as a diagnostic because many quick calculators use a form of it without explaining the dependence problem. Keeping both values beside the formula lets readers test a claim, identify the method used elsewhere, and cite the exact output without implying that every online result is interchangeable.
Scenario dataset
Inspect all 144 exact win-rate, record-length, and streak combinations
The frozen dataset combines six assumed win rates, six completed-outcome counts, and four target streak lengths. Every row contains the exact at-least-one-run probability, its exact no-run complement, the probability for one specified block, the overlapping-window shortcut, and the shortcut error. These are model scenarios, not observations from 144 providers or trading systems.
40% assumed wins: 24 exact sequence scenarios
| Completed outcomes | Target streak | Exact at least one | Exact no streak | One fixed block | Window shortcut | Shortcut error |
|---|---|---|---|---|---|---|
| 20 | 3 losses | 92.77% | 7.23% | 21.600% | 98.75% | 5.98 points |
| 20 | 5 losses | 47.77% | 52.23% | 7.776% | 72.62% | 24.85 points |
| 20 | 7 losses | 16.98% | 83.02% | 2.799% | 32.80% | 15.82 points |
| 20 | 10 losses | 3.02% | 96.98% | 0.605% | 6.45% | 3.43 points |
| 50 | 3 losses | 99.90% | 0.10% | 21.600% | 100.00% | 0.10 points |
| 50 | 5 losses | 83.50% | 16.50% | 7.776% | 97.59% | 14.08 points |
| 50 | 7 losses | 42.56% | 57.44% | 2.799% | 71.33% | 28.77 points |
| 50 | 10 losses | 9.98% | 90.02% | 0.605% | 22.02% | 12.03 points |
| 100 | 3 losses | 100.00% | 8.556e-5% | 21.600% | 100.00% | 0.00 points |
| 100 | 5 losses | 97.58% | 2.42% | 7.776% | 99.96% | 2.37 points |
| 100 | 7 losses | 68.91% | 31.09% | 2.799% | 93.07% | 24.16 points |
| 100 | 10 losses | 20.49% | 79.51% | 0.605% | 42.42% | 21.92 points |
| 250 | 3 losses | 100.00% | 4.946e-14% | 21.600% | 100.00% | 0.00 points |
| 250 | 5 losses | 99.99% | 7.590e-3% | 7.776% | 100.00% | 0.01 points |
| 250 | 7 losses | 95.07% | 4.93% | 2.799% | 99.90% | 4.83 points |
| 250 | 10 losses | 45.21% | 54.79% | 0.605% | 76.81% | 31.60 points |
| 500 | 3 losses | 100.00% | 1.984e-29% | 21.600% | 100.00% | 0.00 points |
| 500 | 5 losses | 100.00% | 5.115e-7% | 7.776% | 100.00% | 0.00 points |
| 500 | 7 losses | 99.77% | 0.23% | 2.799% | 100.00% | 0.23 points |
| 500 | 10 losses | 70.55% | 29.45% | 0.605% | 94.91% | 24.36 points |
| 1,000 | 3 losses | 100.00% | 3.192e-60% | 21.600% | 100.00% | 0.00 points |
| 1,000 | 5 losses | 100.00% | 2.322e-15% | 7.776% | 100.00% | 0.00 points |
| 1,000 | 7 losses | 100.00% | 4.941e-4% | 2.799% | 100.00% | 0.00 points |
| 1,000 | 10 losses | 91.49% | 8.51% | 0.605% | 99.75% | 8.27 points |
50% assumed wins: 24 exact sequence scenarios
| Completed outcomes | Target streak | Exact at least one | Exact no streak | One fixed block | Window shortcut | Shortcut error |
|---|---|---|---|---|---|---|
| 20 | 3 losses | 78.70% | 21.30% | 12.500% | 90.96% | 12.26 points |
| 20 | 5 losses | 24.99% | 75.01% | 3.125% | 39.83% | 14.84 points |
| 20 | 7 losses | 5.82% | 94.18% | 0.781% | 10.40% | 4.58 points |
| 20 | 10 losses | 0.59% | 99.41% | 0.098% | 1.07% | 0.48 points |
| 50 | 3 losses | 98.27% | 1.73% | 12.500% | 99.84% | 1.56 points |
| 50 | 5 losses | 55.19% | 44.81% | 3.125% | 76.79% | 21.60 points |
| 50 | 7 losses | 16.53% | 83.47% | 0.781% | 29.19% | 12.65 points |
| 50 | 10 losses | 2.04% | 97.96% | 0.098% | 3.93% | 1.89 points |
| 100 | 3 losses | 99.97% | 0.03% | 12.500% | 100.00% | 0.03 points |
| 100 | 5 losses | 81.01% | 18.99% | 3.125% | 95.25% | 14.24 points |
| 100 | 7 losses | 31.75% | 68.25% | 0.781% | 52.16% | 20.41 points |
| 100 | 10 losses | 4.41% | 95.59% | 0.098% | 8.51% | 4.09 points |
| 250 | 3 losses | 100.00% | 9.137e-8% | 12.500% | 100.00% | 0.00 points |
| 250 | 5 losses | 98.56% | 1.44% | 3.125% | 99.96% | 1.40 points |
| 250 | 7 losses | 62.69% | 37.31% | 0.781% | 85.25% | 22.56 points |
| 250 | 10 losses | 11.20% | 88.80% | 0.098% | 20.98% | 9.78 points |
| 500 | 3 losses | 100.00% | 7.339e-17% | 12.500% | 100.00% | 0.00 points |
| 500 | 5 losses | 99.98% | 0.02% | 3.125% | 100.00% | 0.02 points |
| 500 | 7 losses | 86.36% | 13.64% | 0.781% | 97.92% | 11.56 points |
| 500 | 10 losses | 21.45% | 78.55% | 0.098% | 38.10% | 16.65 points |
| 1,000 | 3 losses | 100.00% | 4.736e-35% | 12.500% | 100.00% | 0.00 points |
| 1,000 | 5 losses | 100.00% | 3.684e-6% | 3.125% | 100.00% | 0.00 points |
| 1,000 | 7 losses | 98.18% | 1.82% | 0.781% | 99.96% | 1.78 points |
| 1,000 | 10 losses | 38.54% | 61.46% | 0.098% | 62.03% | 23.48 points |
60% assumed wins: 24 exact sequence scenarios
| Completed outcomes | Target streak | Exact at least one | Exact no streak | One fixed block | Window shortcut | Shortcut error |
|---|---|---|---|---|---|---|
| 20 | 3 losses | 56.24% | 43.76% | 6.400% | 69.59% | 13.35 points |
| 20 | 5 losses | 10.01% | 89.99% | 1.024% | 15.18% | 5.18 points |
| 20 | 7 losses | 1.44% | 98.56% | 0.164% | 2.27% | 0.83 points |
| 20 | 10 losses | 0.07% | 99.93% | 0.010% | 0.12% | 0.04 points |
| 50 | 3 losses | 88.63% | 11.37% | 6.400% | 95.82% | 7.19 points |
| 50 | 5 losses | 25.65% | 74.35% | 1.024% | 37.72% | 12.07 points |
| 50 | 7 losses | 4.32% | 95.68% | 0.164% | 6.96% | 2.64 points |
| 50 | 10 losses | 0.26% | 99.74% | 0.010% | 0.43% | 0.17 points |
| 100 | 3 losses | 98.80% | 1.20% | 6.400% | 99.85% | 1.05 points |
| 100 | 5 losses | 45.91% | 54.09% | 1.024% | 62.77% | 16.86 points |
| 100 | 7 losses | 8.95% | 91.05% | 0.164% | 14.28% | 5.34 points |
| 100 | 10 losses | 0.58% | 99.42% | 0.010% | 0.95% | 0.37 points |
| 250 | 3 losses | 100.00% | 1.421e-3% | 6.400% | 100.00% | 0.00 points |
| 250 | 5 losses | 79.17% | 20.83% | 1.024% | 92.05% | 12.88 points |
| 250 | 7 losses | 21.52% | 78.48% | 0.164% | 32.97% | 11.46 points |
| 250 | 10 losses | 1.51% | 98.49% | 0.010% | 2.50% | 0.99 points |
| 500 | 3 losses | 100.00% | 1.877e-8% | 6.400% | 100.00% | 0.00 points |
| 500 | 5 losses | 95.76% | 4.24% | 1.024% | 99.39% | 3.64 points |
| 500 | 7 losses | 38.73% | 61.27% | 0.164% | 55.52% | 16.79 points |
| 500 | 10 losses | 3.05% | 96.95% | 0.010% | 5.02% | 1.97 points |
| 1,000 | 3 losses | 100.00% | 3.279e-18% | 6.400% | 100.00% | 0.00 points |
| 1,000 | 5 losses | 99.82% | 0.18% | 1.024% | 100.00% | 0.17 points |
| 1,000 | 7 losses | 62.66% | 37.34% | 0.164% | 80.41% | 17.75 points |
| 1,000 | 10 losses | 6.05% | 93.95% | 0.010% | 9.87% | 3.82 points |
70% assumed wins: 24 exact sequence scenarios
| Completed outcomes | Target streak | Exact at least one | Exact no streak | One fixed block | Window shortcut | Shortcut error |
|---|---|---|---|---|---|---|
| 20 | 3 losses | 31.03% | 68.97% | 2.700% | 38.90% | 7.87 points |
| 20 | 5 losses | 2.78% | 97.22% | 0.243% | 3.82% | 1.04 points |
| 20 | 7 losses | 0.22% | 99.78% | 0.022% | 0.31% | 0.08 points |
| 20 | 10 losses | 4.724e-3% | 100.00% | 5.905e-4% | 6.495e-3% | 0.00 points |
| 50 | 3 losses | 62.48% | 37.52% | 2.700% | 73.12% | 10.65 points |
| 50 | 5 losses | 7.66% | 92.34% | 0.243% | 10.59% | 2.93 points |
| 50 | 7 losses | 0.68% | 99.32% | 0.022% | 0.96% | 0.28 points |
| 50 | 10 losses | 0.02% | 99.98% | 5.905e-4% | 0.02% | 0.01 points |
| 100 | 3 losses | 86.39% | 13.61% | 2.700% | 93.16% | 6.77 points |
| 100 | 5 losses | 15.26% | 84.74% | 0.243% | 20.83% | 5.57 points |
| 100 | 7 losses | 1.44% | 98.56% | 0.022% | 2.04% | 0.60 points |
| 100 | 10 losses | 0.04% | 99.96% | 5.905e-4% | 0.05% | 0.02 points |
| 250 | 3 losses | 99.35% | 0.65% | 2.700% | 99.89% | 0.54 points |
| 250 | 5 losses | 34.50% | 65.50% | 0.243% | 45.04% | 10.54 points |
| 250 | 7 losses | 3.68% | 96.32% | 0.022% | 5.20% | 1.52 points |
| 250 | 10 losses | 0.10% | 99.90% | 5.905e-4% | 0.14% | 0.04 points |
| 500 | 3 losses | 100.00% | 4.063e-3% | 2.700% | 100.00% | 0.00 points |
| 500 | 5 losses | 57.36% | 42.64% | 0.243% | 70.08% | 12.72 points |
| 500 | 7 losses | 7.30% | 92.70% | 0.022% | 10.24% | 2.94 points |
| 500 | 10 losses | 0.20% | 99.80% | 5.905e-4% | 0.29% | 0.09 points |
| 1,000 | 3 losses | 100.00% | 1.595e-7% | 2.700% | 100.00% | 0.00 points |
| 1,000 | 5 losses | 81.93% | 18.07% | 0.243% | 91.14% | 9.21 points |
| 1,000 | 7 losses | 14.14% | 85.86% | 0.022% | 19.54% | 5.40 points |
| 1,000 | 10 losses | 0.41% | 99.59% | 5.905e-4% | 0.58% | 0.17 points |
80% assumed wins: 24 exact sequence scenarios
| Completed outcomes | Target streak | Exact at least one | Exact no streak | One fixed block | Window shortcut | Shortcut error |
|---|---|---|---|---|---|---|
| 20 | 3 losses | 11.24% | 88.76% | 0.800% | 13.46% | 2.22 points |
| 20 | 5 losses | 0.42% | 99.58% | 0.032% | 0.51% | 0.10 points |
| 20 | 7 losses | 0.01% | 99.99% | 0.001% | 0.02% | 0.00 points |
| 20 | 10 losses | 9.216e-5% | 100.00% | 1.024e-5% | 1.126e-4% | 0.00 points |
| 50 | 3 losses | 27.07% | 72.93% | 0.800% | 31.99% | 4.92 points |
| 50 | 5 losses | 1.18% | 98.82% | 0.032% | 1.46% | 0.28 points |
| 50 | 7 losses | 0.05% | 99.95% | 0.001% | 0.06% | 0.01 points |
| 50 | 10 losses | 3.379e-4% | 100.00% | 1.024e-5% | 4.198e-4% | 0.00 points |
| 100 | 3 losses | 47.44% | 52.56% | 0.800% | 54.49% | 7.05 points |
| 100 | 5 losses | 2.44% | 97.56% | 0.032% | 3.03% | 0.59 points |
| 100 | 7 losses | 0.10% | 99.90% | 0.001% | 0.12% | 0.02 points |
| 100 | 10 losses | 7.475e-4% | 100.00% | 1.024e-5% | 9.318e-4% | 0.00 points |
| 250 | 3 losses | 80.32% | 19.68% | 0.800% | 86.36% | 6.04 points |
| 250 | 5 losses | 6.12% | 93.88% | 0.032% | 7.57% | 1.45 points |
| 250 | 7 losses | 0.25% | 99.75% | 0.001% | 0.31% | 0.06 points |
| 250 | 10 losses | 1.976e-3% | 100.00% | 1.024e-5% | 2.468e-3% | 0.00 points |
| 500 | 3 losses | 96.17% | 3.83% | 0.800% | 98.17% | 2.00 points |
| 500 | 5 losses | 11.95% | 88.05% | 0.032% | 14.68% | 2.73 points |
| 500 | 7 losses | 0.50% | 99.50% | 0.001% | 0.63% | 0.13 points |
| 500 | 10 losses | 4.024e-3% | 100.00% | 1.024e-5% | 5.028e-3% | 0.00 points |
| 1,000 | 3 losses | 99.86% | 0.14% | 0.800% | 99.97% | 0.11 points |
| 1,000 | 5 losses | 22.54% | 77.46% | 0.032% | 27.30% | 4.76 points |
| 1,000 | 7 losses | 1.01% | 98.99% | 0.001% | 1.26% | 0.25 points |
| 1,000 | 10 losses | 8.120e-3% | 99.99% | 1.024e-5% | 0.01% | 0.00 points |
90% assumed wins: 24 exact sequence scenarios
| Completed outcomes | Target streak | Exact at least one | Exact no streak | One fixed block | Window shortcut | Shortcut error |
|---|---|---|---|---|---|---|
| 20 | 3 losses | 1.62% | 98.38% | 0.100% | 1.78% | 0.16 points |
| 20 | 5 losses | 0.01% | 99.99% | 1.000e-3% | 0.02% | 0.00 points |
| 20 | 7 losses | 1.270e-4% | 100.00% | 1.000e-5% | 1.400e-4% | 0.00 points |
| 20 | 10 losses | 1.000e-7% | 100.00% | 1.000e-8% | 1.100e-7% | 0.00 points |
| 50 | 3 losses | 4.25% | 95.75% | 0.100% | 4.69% | 0.44 points |
| 50 | 5 losses | 0.04% | 99.96% | 1.000e-3% | 0.05% | 0.00 points |
| 50 | 7 losses | 3.970e-4% | 100.00% | 1.000e-5% | 4.400e-4% | 0.00 points |
| 50 | 10 losses | 3.700e-7% | 100.00% | 1.000e-8% | 4.100e-7% | 0.00 points |
| 100 | 3 losses | 8.48% | 91.52% | 0.100% | 9.34% | 0.86 points |
| 100 | 5 losses | 0.09% | 99.91% | 1.000e-3% | 0.10% | 0.01 points |
| 100 | 7 losses | 8.470e-4% | 100.00% | 1.000e-5% | 9.400e-4% | 0.00 points |
| 100 | 10 losses | 8.200e-7% | 100.00% | 1.000e-8% | 9.100e-7% | 0.00 points |
| 250 | 3 losses | 20.07% | 79.93% | 0.100% | 21.97% | 1.91 points |
| 250 | 5 losses | 0.22% | 99.78% | 1.000e-3% | 0.25% | 0.02 points |
| 250 | 7 losses | 2.197e-3% | 100.00% | 1.000e-5% | 2.440e-3% | 0.00 points |
| 250 | 10 losses | 2.170e-6% | 100.00% | 1.000e-8% | 2.410e-6% | 0.00 points |
| 500 | 3 losses | 36.22% | 63.78% | 0.100% | 39.24% | 3.02 points |
| 500 | 5 losses | 0.45% | 99.55% | 1.000e-3% | 0.49% | 0.05 points |
| 500 | 7 losses | 4.447e-3% | 100.00% | 1.000e-5% | 4.940e-3% | 0.00 points |
| 500 | 10 losses | 4.420e-6% | 100.00% | 1.000e-8% | 4.910e-6% | 0.00 points |
| 1,000 | 3 losses | 59.39% | 40.61% | 0.100% | 63.16% | 3.77 points |
| 1,000 | 5 losses | 0.89% | 99.11% | 1.000e-3% | 0.99% | 0.10 points |
| 1,000 | 7 losses | 8.947e-3% | 99.99% | 1.000e-5% | 9.940e-3% | 0.00 points |
| 1,000 | 10 losses | 8.920e-6% | 100.00% | 1.000e-8% | 9.910e-6% | 0.00 points |
For fixed p and r, the chance of at least one target run cannot decrease as n grows. For fixed n and r, it cannot decrease as loss probability q grows. For fixed p and n, it cannot increase when the target run is made longer. The checker enforces these relationships across the frozen grid.
Evidence workflow
Use the probability only after the underlying record passes basic gates
A sequence calculation can be internally exact while the input record is externally unreliable. Before using a streak probability to interpret a signal service, preserve the chronology and separate mathematical assumptions from evidence claims. If a gate cannot be passed, keep the conclusion unresolved instead of compensating with more decimal places.
- Freeze eligibility before outcomes are knownDefine which alerts enter the denominator, including time window, channel, asset scope, entry rule, and whether updates or duplicate calls count. Retrospective eligibility lets a record remove inconvenient losses.
- Preserve the complete chronological sequenceA run question needs order. A summary containing only total wins and losses cannot reconstruct streaks. Keep timestamps, entries, stops, targets, edits, cancellations, open calls, and final classifications in sequence.
- Use one binary outcome ruleMultiple targets, partial exits, moved stops, breakeven labels, timeouts, and unfilled entries need a rule fixed before comparison. Do not silently force ambiguous calls into whichever class improves the rate.
- Estimate the win probability separatelyThe entered rate is an assumption. Use the win-rate confidence calculator to see how much interval uncertainty remains around a completed binary record. Neither page verifies the record itself.
- Inspect dependence and market regimesOverlapping trades, repeated calls on one asset, common market direction, copied entries, and clustered volatility can make outcomes dependent. A constant-p independent model may understate or overstate real streak behavior.
- Keep loss size and execution separateThree small losses and three leveraged liquidation losses have the same run length but radically different consequences. Use the risk-reward guide for payoff questions and preserve fees, spread, slippage, funding, and fill evidence.
- State the narrow conclusionReport the exact model probability with p, n, r, method, and assumptions. Do not turn it into a provider verdict, forecast, recommendation, accusation, or promise that an account can survive the sequence.
Interpretation limits
Five conclusions the calculator does not support
It does not prove a streak is suspicious
A run that feels surprising may be compatible with a random model, especially across many opportunities. Conversely, one observed run does not establish independence. Formal nonrandomness testing is a different question and requires a defensible dataset and test design.
It does not prove a high win rate is false
The tool accepts an assumed rate and calculates its implications. It does not audit whether the rate came from complete calls, fair outcome rules, live execution, hypothetical backtests, or selected screenshots.
It does not estimate drawdown
Run length counts consecutive outcomes, not monetary depth. Drawdown depends on loss magnitude, sequence of returns, position size, leverage, compounding, and whether simultaneous positions share risk.
It does not set a safe risk percentage
A user can combine a streak scenario with separate capital constraints, but this page provides no optimal stake, leverage, stop, liquidation distance, or account-survival recommendation.
It does not rank providers
No provider names, ratings, testimonials, affiliate offers, or paid placements enter the formula. Coverage remains separate from endorsement, and sponsorship cannot buy a lower streak result or remove a boundary note.
It does not predict the next outcome
The model describes the probability of at least one run across a fixed horizon. It does not say that a win or loss is due, and it does not reverse a streak because of the gambler’s fallacy.
Sources and reproducibility
Primary probability references, official risk context, and downloadable evidence
The public method chain separates technical probability sources from investor-protection context. Cornell’s report addresses exact run probabilities and recursion. The recurrence paper connects waiting times and longest runs in independent and Markov-dependent Bernoulli sequences. NIST defines the binary fixed-probability model and explains why randomness is an assumption worth checking. The CFTC supplies the trading-system boundary around hypothetical results, consecutive losses, market conditions, and omitted costs.
- Run Probabilities in Sequences of Bernoulli TrialsCornell University Biometrics Unit | accessed 2026-07-13
Primary technical source for the exact probability of at least one run of k successive outcomes in n Bernoulli trials and for a recursive solution.
Boundary: The report studies Bernoulli runs generally. The implementation uses an equivalent finite-state complement recurrence and does not claim that real trading outcomes are independent or identically distributed.
- Recurrence algorithms of waiting time for the success run of length k in relation to generalized Fibonacci sequencesarXiv | accessed 2026-07-13
Primary research context for recurrence algorithms, waiting times, longest runs, and the distinction between independent and Markov-dependent Bernoulli trials.
Boundary: The calculator implements only the independent, constant-probability model and prominently excludes Markov dependence.
- 1.3.6.6.18. Binomial DistributionNIST/SEMATECH | accessed 2026-07-13
Official reference for two mutually exclusive outcomes and the fixed single-trial probability assumption.
Boundary: A binomial count distribution alone does not answer an order-sensitive run question; the calculator adds an explicit run-state recurrence.
- 1.3.5.13. Runs Test for Detecting Non-randomnessNIST/SEMATECH | accessed 2026-07-13
Official context that runs are consecutive dichotomous values and that randomness is an assumption to inspect rather than silently grant.
Boundary: The calculator is not a runs test, does not compute a p-value, and does not diagnose nonrandomness from one observed streak.
- Fraud Advisory: Commodity Trading Systems Sold on the InternetU.S. Commodity Futures Trading Commission | accessed 2026-07-13
Official investor-protection context on consecutive losses, hypothetical performance, actual market conditions, omitted costs, and break-even effects.
Boundary: The advisory concerns commodity futures and options trading systems, not every crypto product or jurisdiction. It does not validate this model, evaluate a crypto-signal provider, or turn a streak probability into a risk-sizing recommendation.
Derived scenario rows may be reused with the canonical URL, assumed win rate, completed-outcome count, target streak length, independent constant-probability model, exact recurrence label, research date, and decision boundary intact. Do not relabel model output as verified provider performance, a forecast, profitability, safety, or trading advice. Submit corrections through the evidence route. Paid production, sponsorship, or profile work cannot alter the formula, dataset, source boundary, or conclusion.
Continue the decision chain
Connect run probability to uncertainty, payoff, and provider evidence
Preserve the complete loss-inclusive chronology, define the binary outcome rule, and estimate the win-rate uncertainty. Then use this calculator as one sequence-risk lens. If the record, independence, or fixed-probability assumptions cannot be defended, label the model result as illustrative and keep the provider conclusion unresolved.